
A gradual but inevitable descent into cricket-based loathing and bile.
How Good Was Michael Clarke’s Annus?
While laughing at Australia continues to be an essential part of the 51allout experience – we usually have to force the work experience boy to edit the weekly podcast down from three hours of said laughing to about 35 minutes in the vain hope that someone might actually listen to it – we’ve all rather taken to Michael Clarke since he took over from Rat Face Ponting as the leader of the opposition. Pup’s mix of maverick bowling selections, aggressive declarations and general ability to carry the rest of that enormous shower on his shoulders has impressed everyone. Add into that the fact that he’s scored around a million runs since taking charge and it’s easy to see why he’s caught the public imagination around the cricketing world. Plus his missus is quite tidy, which counts for quite a lot round these parts.
For the last few months it seems that the only thing Channel Nine have talked about is Clarke’s amazing year. We have no real way of knowing if that’s true, or just the only bit we can remember from the extreme gin sessions required to get through Channel Nine’s coverage. Either way, it got us thinking: just how good was Michael Clarke’s 2012? Was it really the best thing ever (bar KFC, Toyota and Victoria Bitter, obviously)? Or was it merely fairly decent?

Victoria Bitter: back to its best, apparently. Other beers are also available, i.e. ones that don’t taste like petrol.
There are various different ways to try and answer this question. One would be to simply inflict physical pain onto the work experience boy until he provided some answers (which would probably take a reasonably long time – for all his faults he has a very high pain threshold). In this case we chose the other option of putting on our Scorer’s Notes hats and doing some sums.
Looking at performance by calendar year is often a rather arbitrary approach to international cricket analysis. Unlike the world of football, where each year brings a similar number of matches (even though it crosses two different seasons), in cricket there can be huge variations from one set of twelve months to the next. In some cases players may play 15 Test matches in a year, in others just two. As a result, even though it’s clearly an impressive achievement, being the leading runscorer in the year isn’t really an accolade that gets shouted about too often.
Going all the way back to 1960 (a fairly arbitrary cut-off point, although Cameroon gaining its independence on January 1st is one of our favourite historical events) gives us a fairly whopping 53 years of Test cricket to look at. Over that period 39 different players have been the leading Test runscorer in the year. Ken Barrington and Sunil Gavaskar actually did it four times each, something which it’s hard to describe as anything other than impressive. The other players to do it more than once reads like a who’s who of cricket greats: Sobers, Viv Richards, Greg Chappell, Gooch, Boon, Tendulkar and Ponting, all of whom did it twice. And, er, Alec Stewart.
(Sobers actually did it in 1958 as well. Not that the OCD element of us went and checked or anything).
But more interesting than the individuals is the number of runs scored to achieve the feat each year. Obviously this varies quite widely. For instance, Viv Richards topped the charts with 1,710 runs in 1976 whereas the following year’s winner was Greg Chappell with just 736. In order to cope with this we’ll just take an average by decade, which gives us a trend that looks like this:
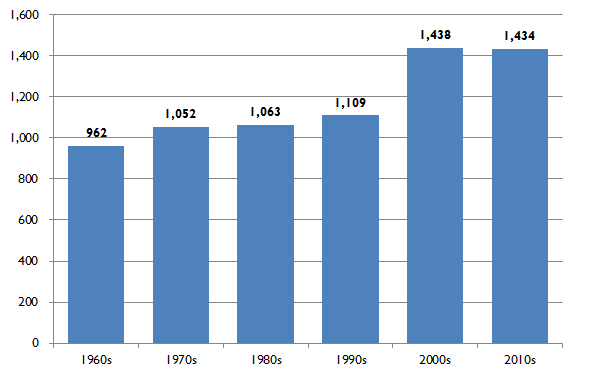 Although we obviously don’t have a full set of data for the 2010s (the 51allout TARDIS is currently in for repairs after someone spilled gin on the main console) there’s already quite an interesting trend, with a very gradual increase from 1960-1999 followed by a big jump in the following thirteen years. This can probably be put down to a number of factors – more Tests, a shift towards batsman friendly conditions and the rise of Saj Mahmood.
As we can see, on average a batsman top-scoring nowadays can be expected to score around 1,434 runs compared to 962 in the 1960s, an increase of around 49%. Therefore if we want to compare across the different times we’ll need to use something a bit smarter. And that something is called relative market share (or RMS for short).
RMS is used in the world of retail to determine a brand’s (or product/channel/whatever) competitive strength vs. its nearest competitor and is a slightly more complicated version of normal market share. We’ll use an example to illustrate this, based on cricket-related internet hits for 2012 and our best estimates for 2013:
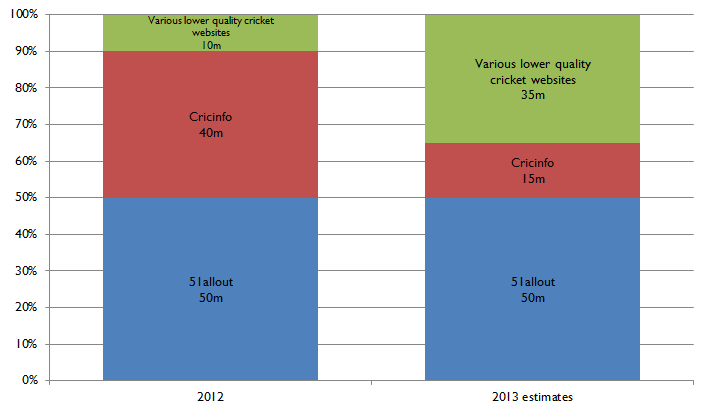
As you can see from this data, we’re not really pushing the boat out with our growth estimates this year. Either way, in both 2012 and 2013 we reckon that 51allout will have a 50% share of the total cricket market. However, in 2012 we were pushed closely by Cricinfo, whereas in 2013 we reckon they’ll drop off a bit, presumably when the excitement over those hilarious cartoons wears off.
To calculate RMS for the market leader we simply do market leader/second place, so 50m/40m = 1.25 in 2012 and 50m/15m = 3.33 in 2013. The larger the relative market share number, the stronger the position in the market. As such, by the end of 2013 we’re expecting to be in a pretty dominant position. We’ll probably sell this website to ITV by then, allowing us all to retire to the West Indies and drink gin/rum cocktails all day.
And what does this have to do with the top run-scorers in Test cricket each year? Well, we can actually use RMS to tell us something important, specifically how good the performance of said top run-scorer compares to the second best. We can then look at those with the highest RMS numbers to see those performances that noticeably stand out from their peers. Time for another chart:
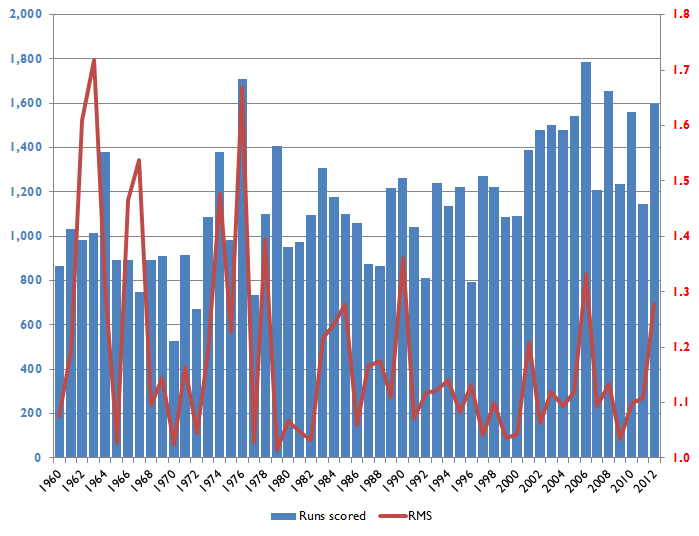
Here we have the number of runs scored by the top scorer each year (the blue bar and the left hand axis) and their RMS (the red line and the right hand axis). We’re mostly interested in the peaks of the latter. At the far right we have Michael Clarke’s 2012, which has an RMS score of 1.28, which is decent but only the 12th best in our chart (due to Alastair Cook’s 1,249 runs over the same period). If we head back to 2006 we have a more impressive performance, with Mohammad Yousuf’s 1,788 runs more than 400 clear of second placed Kevin Pietersen.
The really interesting results are further back in the mists of time. Back in 1990 England had the top three scorers in the world. Graeme Gooch was the highest with 1,264 runs with Allan Lamb a distant second on 929. It was a similar story in 1978, with Sunil Gavaskar (1,099) miles ahead of Alvin Kallicharran (788), and 1976 where Viv Richards made an incredible 1,710 runs, 1.67 times as many as Gavaskar (1,024). And 1974’s men of achievement were Dennis Amiss (1,379) ahead of the late Tony Greig (934).
But the biggest RMS value is all the way back in 1963 where Ken Barrington made 1,015 runs and no-one else reached 600. Presumably they were all too busy thinking about the Beatles and celebrating Cameroon’s third birthday to build a proper innings.
So what has this taught us? Mainly that the top run-scorer of the year is a fairly meaningless accolade, given the vagaries of the Future Tours Programme. In the world of statistics life is all about ‘like for like’ comparisons, whereas this analysis is the exact opposite, focusing on some individual flourishes. We could look at the combinations of runs scored and RMS and try to draw some hard conclusions there, but we’re better off just using our intuition. And that tells us that while Michael Clarke had a superb year, it wasn’t quite up there with Mohammad Yousuf in 2006 or Viv Richards in 1976. Clarke’s year belongs in a second tier just below these top efforts. Which basically means you can shut up about it now Channel Nine, thank you very much.
Latest Poll

2 Comments
Post a Comment
1
James Knight
30 Jan 2013 06:29
I find the stroppiness in your response a little confusing – you admit in the first paragraph that the article suggests Clarke’s year was third best behind Yousuf and Richards, then proceed to spend the next three complaining about it slapping his achievement down. Which is it?
I would also suggest that averages can be misleading as well. To continue this Cook/Clarke comparison you seem to have seized upon, despite it only being mentioned in passing as the reason Clarke’s ‘RMS’ wasn’t as high as some others in the actual piece, simple average would suggest that his 210 against India in Adelaide at the start of this year was better than Cook’s 122 against the same opposition in Mumbai. As much as I am a fan of Clarke, given the respective points in the series, the conditions, all of history of England in India to that point, and the fact India were pretty much curled up in the foetal position by the time they reached that final test in Australia, surely the 122 was far more significant an innings?
So focusing on his average wouldn’t be entirely satisfactory anyway. It doesn’t add relative weight to innings or performances, Clarke had a better 2012, so much as you can define these things, than Cook, but I haven’t seen anyone arguing otherwise!
The other problem with averages is that playing fewer innings works in the batsman’s favour, generally. England only played 8 tests (I think, from memory) in 2011, and such their averages were mental. Ian Bell averaged over 110. So if we were to use averages alone, a statistic everyone already knows anyway, it would tell us that Ian Bell’s 2011 was actually better than Clarke’s 2012.
Summary: why are you so furious?
2
Charlie
29 Jan 2013 11:45
Mildly interesting article, although I’m not entirely sure what it has proved other than you seem to think that Clarke’s 2012 is probably the third best year ever for a batsman behind Yousuf and Richards, which is a massive compliment. However, this article (apart from being extremely self indulgent) is focused purely on aggregates, and as you admit, these days with the inconsistency of fixtures and varying numbers of test matches played each season it is not an accurate assessment at all.
So despite Clarke having the 4th highest aggregate for a calendar year ever, what really stands out for me (and what you have managed to conveniently avoid) is his impressive 2012 test average of 106.33, which is the third highest of all time. So if you are so anti-Clarke for his runs scored, why don’t you focus on his average? Let’s see the RMS on that. If you are going to dissect Michael Clarke’s year then do it properly, instead of just focussing on his aggregate to somehow create a mythical one-sided statistic than means absolutely nothing. Perhaps your highly talented in-house analysts (failed or wannabe bookies or traders no doubt) can create another graph highlighting aggregate runs vs. average vs. opposition played vs. centuries made vs. double-centuries made vs. pitches played on etc etc… Getting the drift?
Besides, I also don’t see for one minute how this article adds any weight to an argument of Michael Clarke being over-rated, if that was indeed your intention. If anything you have merely highlighted his achievements. You have pointed out that Clarke’s RMS is not fantastic because of how many runs Cook scored in 2012, funny how you forget to mention that Cook played 29 innings in 2012 compared to Clarke’s 18 innings.
On that subject, if you want to talk about being over-rated then write an article on Alastair Cook’s 2012. The Sky and TMS team seemed to be over-whelmed with his performances this year. Guess what? His average for 2012 was 48.04, ranking him at no.14 – wow, no.14!! Yes, he was the second highest run maker (behind Clarke), but he played 29 innings, more than any other batsman. No batsman outside of the England team played more than 20 test match innings in 2012.
This really is ‘by numpties for numpties’ isn’t it?