
A gradual but inevitable descent into cricket-based loathing and bile.
Making A Contribution (Again)
We’ve talked about the concept of ‘contribution’ a few times before, most notably here. With more than three years having passed without a single person asking us not to expand the concept, the time has clearly come for us to take on board that lack of overridingly negative press covfefe and expand the concept. Let it never be said that we don’t listen to what the people aren’t saying.
To start with though, we’ll take a few words to go back over how we define contribution, partly to help those who haven’t read the previous articles but also to set up a standard issue joke about Jonny Bairstow’s keeping. While everyone can have an opinion about how good a player may or may not be, that’s largely subjective, a matter of opinion, like when weirdos bang on about Kemar Roach being world class. Runs, wickets, catches and stumpings, however, are not subjective, instead being cold, hard numbers and therefore much easier to put into spreadsheets. Hence we’ll take all the subjectivity out of the question and allocate contribution points based on the following simple logic:
- Each run scored equals one point;
- Each wicket taken is worth 20 points (so that a five wicket haul equates to a century with the bat);
- Each catch taken is worth five points; and
- A stumping is ten points.
The need to reapply sunscreen yet again saw the ball rushing to the boundary unhindered.
On its own, this contribution score isn’t that meaningful. But if we look at it as a percentage of the team total, we can start to draw insight from it (as opposed to just giving awards to those with the biggest numbers). Here we’ll take the concept a little further and look at a player’s average contribution percentage over their career to ascertain once and for all who is ‘best’ in terms of ‘doing useful stuff’. But why use this particular measure? Well actually, it can show us a number of things, some of which aren’t otherwise clear from the more traditional statistics. For instance, when we look at batting average or runs scored, that never takes into account the fact that making 40 when a team gets bowled out for 150 is a lot more significant (27%) than making 40 out of 550 (7%).
Because we’re using an average, it also takes into account consistency over time – if a player contributes nothing to one game and a lot to the next, both matches count equally, rather than the big numbers of the latter swamping the former – as well as removing the effects of batting average inflation over time. Basically, this is the future of cricket statistics. Trust us on that one.

Like when we bet the entire office’s gin allowance on Hilary Clinton.
To start with, we can use some results. Here we’re looking at the average contribution per Test match for a bunch of England players. Note that this only takes into account all the matches in which they actually played – even we’re not harsh enough to mark someone down for the crime of not scoring any runs while carrying the drinks. In order to sex up the chart a bit, rather than just show a bunch of straightforward bars, we’ve drawn each one starting from an average contribution of 1/11, or 9.09%.
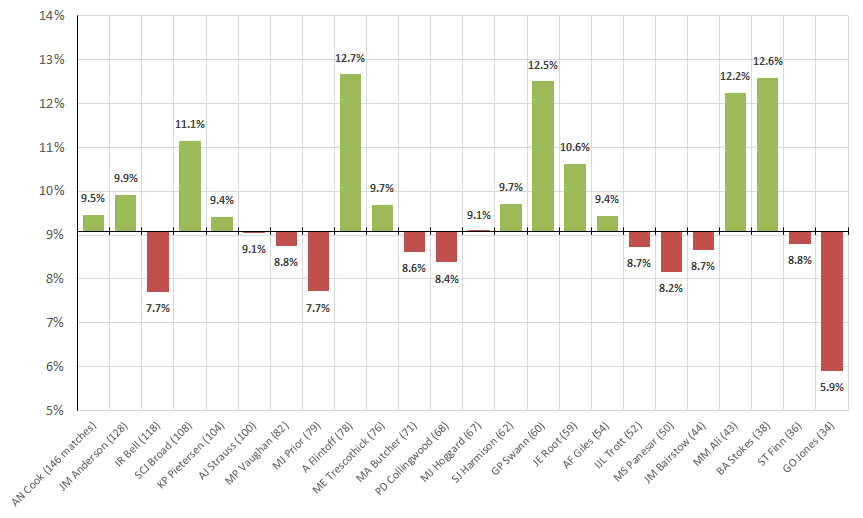
Some key points here: Geraint Jones was rubbish. Messers Ali and Stokes less so. And perhaps Andrew Flintoff was actually quite decent after all.
Of course, like all good pieces of analysis, this raises a number of further questions. For instance, is it fair to expect the same from all players? Of course not. Every time Liam Dawson was selected, we expected nothing whatsoever from him and yet he still managed to underachieve. So ideally, we would compare each player’s actual contribution to some sort of cleverly calculated expected contribution. It sounds simple enough, but it should probably take into account a number of factors, such as:
- Match conditions – we would expect spinners to contribute more on the subcontinent than in New Zealand, for instance.
- Time in the side – in general, we would expect more from Alastair Cook (146 Test caps) than Tom Westley (too many caps). Although that might be because the latter isn’t very good.
- Form – in general, we would expect more from Joe Root (728 runs at 66 this summer) than Dawid Malan (169 at 24). Although that might be because the latter isn’t very good.
- The players around them – this is where it gets really complicated. Given that there’s only 100% contribution to go around in any given match, if we increase our expected contribution for one player, that has to come out of someone else’s share. For instance, when Broad and Anderson are in the side, we would expect them to contribute more than average (based on the points above). Hence that would reduce the expectation on the third seamer. Especially if that third seamer is Jake Ball, because he isn’t very good.
As you might be able to imagine, this is suddenly an extremely complicated model, juggling a number of different inter-related variables. And that’s before we even get into other potential aspects that could be included in any calculation of contribution, such as workload (bowling lots of overs or facing lots of balls). For instance, in this post-facts world, we should give credit to Nick Compton for making 7 from 45 balls against New Zealand at Headingley. Instead of being the world’s most handsome man becoming paralysed with fear and unable to play a shot in anger, this was, in fact, a masterclass in taking the shine off the new ball and should be recognised as such.

Call us shallow, but we probably wouldn’t have been quite so effusive with praise had it been ugly stick victim Keaton Jennings at the crease.
To conclude, this is really just the beginning of a serious piece of data analysis, building in the aforementioned expected contribution and moving towards a Moneyball view of the world. Or it could be the beginning of another three years of sitting around with the 51allout mailbox open, pressing ‘Send/Recieve’ every few seconds, just to check if it’s actually still working.
Latest Poll

No Comments
Post a Comment