
A gradual but inevitable descent into cricket-based loathing and bile.
Botham’s Eleven
The past couple of weeks have seen a remarkable turnaround in the fortunes of many. For Sepp Blatter this hasn’t really been a good thing; for Ben Stokes it’s been the greatest career turnaround since Lazarus came out of retirement purely to annoy Jesus. From being Binary Ben, the man who only managed to hit one thing properly in a year – a locker in the West Indies – to being the new Flintoff. Or possibly the new Botham. Basically, some sort of all-action, all-excitement all-rounder, sent to save England’s Test team from their current position of being a) extremely negative and boring and b) not very good at all.
But beyond the hype – and we might have been a bit guilty of that – there remains the obvious question: actually how good is Stokes? How does he compare to those that have gone before him? In order to try and answer this, we came up with a simple methodology; thrillingly, one that invokes GCSE maths in the form of Pythagoras’s theorem.

With the much-promised 51allout t-shirts no closer to ever happening, we’ve had to resort to wearing these.
Following the end of the two-Test series against New Zealand, Stokes has now played eleven matches. In order to make a fair comparison, we’ll look at the batting and bowling averages of other ‘great’ England all-rounders after the same number of games. If they even made it that far, that is. The likes of Adam Hollioake and Mark Ealham sadly didn’t, instead preferring to follow careers in UFC and competitive eating respectively. Plus there’s the likes of Gavin Hamilton, who famously didn’t even manage to make it so far as to trouble the scorers in his extremely brief Test career.
Anyway, with the contenders selected, we chucked them all into a chart, one that looks a lot like this:
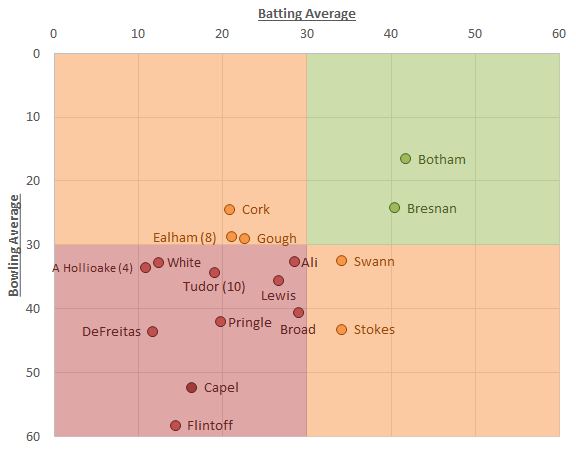
We’ve split the chart into four quadrants, which we can broadly call ‘Bowlers who bat’ (top left), ‘Genuine all-rounders’ (top right), ‘Batsman who bowl’ (bottom right) and ‘Shitty all-rounders’ (bottom left). What this clearly shows us is that there’s an enormous gap between Botham and everyone else, with Tim Bresnan, who made an unforgettable start to his England career, the closest. Disturbingly, there are only seven members of the chart that don’t live in the rather jammed bottom left quadrant. If ever a small red square said anything about English cricket over the last two decades, it’s that one.
Had Beefy actually retired after eleven Tests – perhaps to take up a full time career punching policemen – he’d be remembered as statistically England’s best bowler since the outbreak of World War I, plus one of their very best batsmen. Instead, he carried on for another 90 odd Tests, resulting in a long-term dwindling of his numbers. And it’s important to remember that eleven Tests is still a fairly small sample in the grand scheme of things. Just look at where Flintoff was in the chart and where he ended up, in the relative glory of the bottom right quadrant.
So we’ve ascertained that every single one of our all-rounders is behind Botham both with the bat and the ball, but we can actually use a bit of maths to determine exactly how far behind they are, taking into account both the batting and bowling averages. To do this, we simply draw a line from their point in the chart to Botham’s and work out how long that line is. And how do we do that? By using a spot of good old-fashioned Pythagoras:
Here comes the science bit.
In our examples above we know a and b – the differences in batting and bowling averages to Botham’s – hence we can calculate c, which we’ll call the ‘Botham Deficit’, for want of a better name. We don’t need to think too hard about what this number on its own actually means. Basically though, the bigger this number, the further behind a player is (or was) and the more we can laugh at them. The real significance is in the order of the players in this list:
| Player | Botham Deficit |
|---|---|
| Bresnan | 7.7 |
| Swann | 17.7 |
| Ali | 20.8 |
| Cork | 22.3 |
| Gough | 22.7 |
| Ealham (8 matches) | 24.0 |
| Lewis | 24.3 |
| Broad | 27.2 |
| Stokes | 27.7 |
| Tudor (10 matches) | 28.8 |
| White | 33.5 |
| Pringle | 33.6 |
| A Hollioake (4 matches) | 35.2 |
| DeFreitas | 40.3 |
| Capel | 43.9 |
| Flintoff | 49.8 |
What we can see from this is that, at this stage, Stokes isn’t the best all-rounder England have had since Botham, even if his career has started a hell of a lot better than Flintoff’s. In fact statistically, Stokes isn’t even the best all-rounder in the side at the moment: Moeen Ali holds that distinction by some distance, having also coincidentally played eleven matches. This is, however, something of a double-edged sword. Moeen’s role is all over the place: initially he was picked as a batsman who bowls a bit, a decent option at number six. Then it turned out that he couldn’t play the short ball at all, but could bowl some decent spells of off-spin. As a result he’s ended up at number eight, playing the role of a bowler who bats a bit – and not much more than a bit – leaving England with two fifth bowlers, but no fourth (and a distinct lack of variety).
England’s recent problems haven’t, on the whole, been with the bat, but instead with the ball, mainly in the form of failing to bowl sides out on a fairly regular basis. This was particularly obvious in the West Indies, where, on spinning pitches, Moeen (and Stokes) failed to make any sort of impact, but it was also in evidence at Headingley. When this happens it naturally puts more pressure on Broad and Anderson to do everything on their own, placing yet more burden on crumbling knees and aching ankles.

Jimmy Anderson’s run-up had to be slightly remodelled as he chased 500 Test wickets.
So England now find themselves in an unusual position, with the side unbalanced by too many all-rounders, rather than too few. Quite what they can do to remedy this is another matter. They could try and introduce a genuine front-line spinner, with Simon Kerrigan again looking the man most likely, but that would result in significantly weakening the batting (with Broad, Anderson and Kerrigan all genuine contenders for batting at eleven). And that’s before we even get into the grownup stuff around whether the benefits of having Moeen in the side as an inspiration for the young Muslim community outweigh the fact that his bowling really isn’t all that good, with his numbers over-inflated by India’s ‘can’t be arsed’ approach to last summer’s tour.
Realistically, things will stay as they are for now. But England can’t rely on slow, dry pitches to beat Australia this time – Nathan Lyon is by far the superior spinner, despite a bowling average above 35 – so their best bet is for pitches more suited to swing and seam bowling. And then hoping that Australia’s army of fast bowlers have messed up their visa applications en masse.
Latest Poll

4 Comments
Post a Comment
1
Nichael Bluth
09 Jun 2016 10:49
Yeah, this probably does deserve a sequel. Watch this space…
2
Oliver
01 Jun 2016 03:21
Any chance of an updated version of this graph? Seeing Stokes’ and Ali’s progress (and the likes of Broad and Flintoff as they got a bit better) would be interesting.
For retired players, you could make each of them a graph to show their career progression. Literally dozens of articles for you to write.
3
Nichael Bluth
09 Jun 2015 07:37
Graphs are never a laughing matter.
4
Tim Bresnan’s Heavy Ball
04 Jun 2015 18:10
Do you know what would be an even funnier graph? England all rounders in their last eleven tests. Laugh as pretty much all of them turn to poo before being dropped/retired/sent to the glue factory for good.