
A gradual but inevitable descent into cricket-based loathing and bile.
Botham’s Twelve
It’s probably fair to say that what we know about making movies could probably be written in 18 point font on a particularly dogeared stamp. But even we know that there must be a moment when a storyline comes together and suddenly everyone starts thinking about awards they might win. A story about racism in 1950’s America? That’s a guaranteed Oscar nomination right there. Something about a simple family trying to protect Jews from the Nazis? You can start working on your outfit for the red carpet before the first draft is done.
This sort of epiphany has struck this writer just once, around 12 months ago, as the idea that eventually became Botham’s Eleven came into being. Just thinking of those raw ingredients – England’s shoddy allrounders of the past few years, a bubble chart (with a reversed axis!), some GCSE maths – we could feel the 51allout mantelpiece’s anxiety growing as the prospect of being crushed under numerous small trophies loomed large.
Or possibly being utterly annihilated when we tried to balance a fridge on it.
Of course, twelve months on and not a single nomination has been received, let alone any small gold trophies. In fact, we’ve barely received a single email in that time, at least not one that isn’t trying to sell us solar panels or promising to guarantee us a place on the first page of Google searches. But we did get a comment from someone called Oliver asking for us to revisit the concept of Botham’s Eleven. So here we are.
Last time we looked at the first eleven games for each shoddy England allrounder. This time we’re going to look at the same concept across a whole career for some of the greatest allrounders in the history of Test cricket. And then, most thrillingly of all, we’ll have a bit of a look at how they got there, in the form of wiggle charts, the most freeform of all the charts.

Trying to plot Gavin Hamilton’s Test career proved beyond the limits of Excel 2003.
To start with, we’ll look at the final numbers of some of those great allrounders from days past. Plus Ben Stokes, who still has a fair chunk of his career ahead of him, assuming he doesn’t go back to smashing his fists against lockers every time he gets out cheaply.
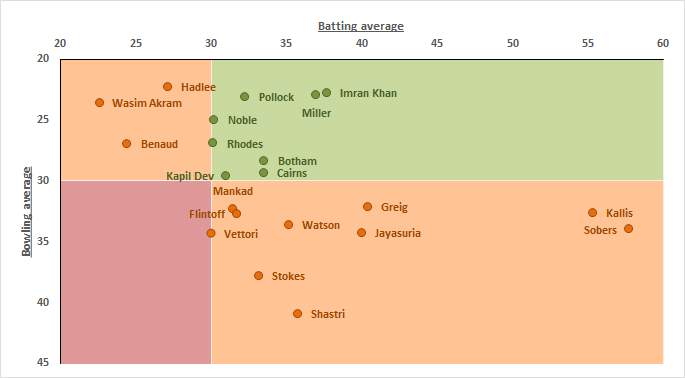
The first thing to note from this is that none of these great allrounders are in the dreaded red zone. Which makes sense really, given that if they were they probably wouldn’t be classed as great allrounders. This oversight means that the bottom left quadrant of our chart is basically wasted space, like a middle order containing James Vince and Gary Ballance.
The top left quadrant, bowlers who bat, is surprisingly light too, containing just three major names in Richie Benaud, Wasim Akram and Sir Richard Hadlee. But there are any number of decent bowlers who could bat a bit over the years and could have been shoehorned in, if we could be bothered changing all the labels to orange, such as the likes of Stuart Broad or Shane Warne. But jamming that quadrant full of bowlers who could vaguely hold a bat isn’t exactly our idea of fun, or particularly helpful.
Instead, the real interest is in that top right quadrant, the green zone for the greatest allrounders that we’ve ever seen. And Chris Cairns. There’s no arguing with the great names in there – Sir Ian Botham, Kapil Dev, Keith Miller, Imran Khan, Wilfred Rhodes, Monty Noble and Shaun Pollock. And Chris Cairns. All of these managed the true allrounder feat of having a bowling average below 30 and a batting average about 30.
The bottom right quadrant is the batsmen who bowl section. Here there are two names that particularly stand out – Jacques Kallis and Sir Garfield Sobers, both of them averaging more than 55 with the bat and around 35 with the ball. Between them they have more than 21,000 Test runs and nearly 550 Test wickets. Phenomenal stuff but, because life can be a cruel mistress, still only enough to get them a place in the orange bit.
Having looked at each player’s final destination, there remains the small matter of the journey to get there. To look at that we’ll break their career down into 10 Test chunks and track their cumulative batting and bowling averages at these milestones. This is a so called ‘wiggle’ chart, something that we have featured before to almost complete silence from the 51allout readership. Maybe Oliver was on holiday that week or something.
Example 1: Jacques Kallis
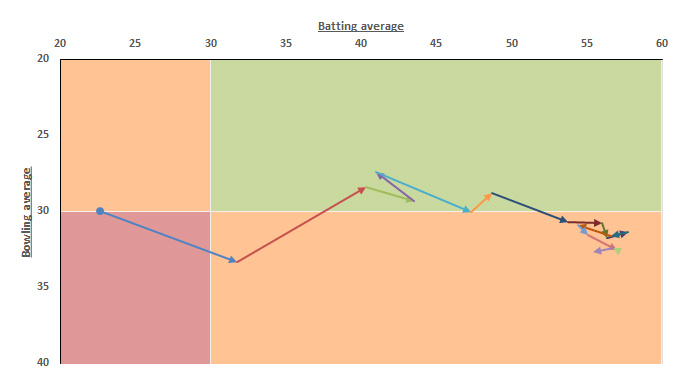
This shows us the long journey of Kallis’s career, with his batting average working up from just 23 (after ten matches) to the around 55 by the end of his career. All while keeping his bowling average between 27 and 33. Incredible stuff, really. Even as his career wound up, there was no dwindling of his numbers. For us, he’s the greatest allrounder there’s ever been, just ahead of Mark Ealham.
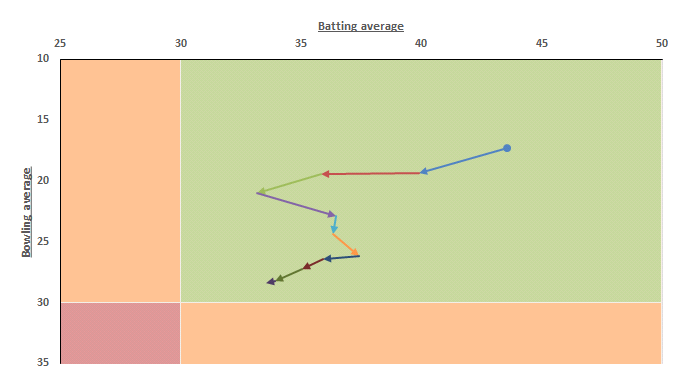
Example 2: Imran Khan
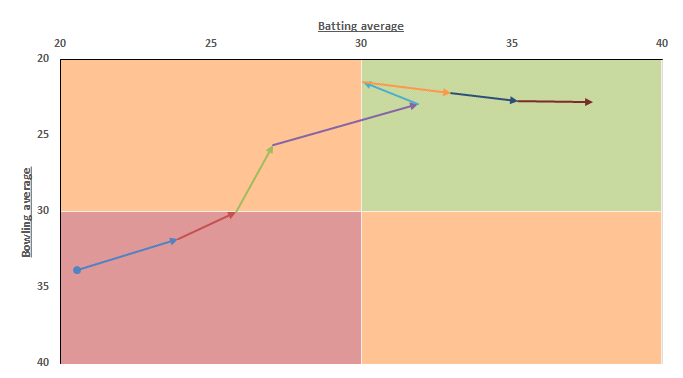
Another long journey of almost continuous improvement for a man who, now we’ve given it a bit more thought, could well be the greatest allrounder ever, just ahead of Mark Ealham. The remarkable thing about this is that, in almost every case, Imran improved his career numbers. His batting went from strength to strength, while his bowling followed suit, with a final average of 22.81 being ruddy bloody good by anyone’s standards.
Example 3: Shane Watson
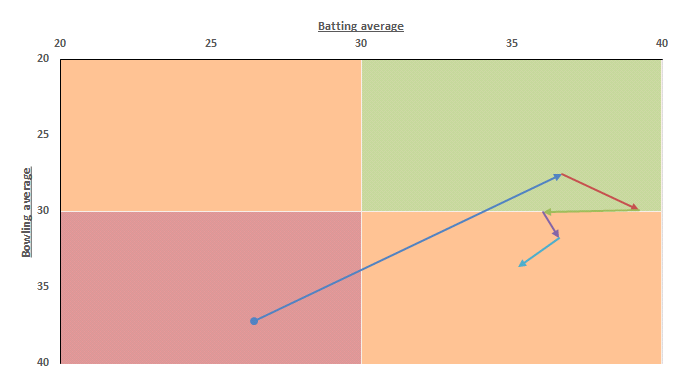
Shane Watson’s tribulations have been discussed at some length before. To summarise, he was kind of alright at times, although never seemed to really get the two aspects of his game working at the same time, hence the up/down/back/forwards nature of his chart. Plus he always looked totally bewildered by everything that was going on, as if he’d just nipped down the shops to buy some milk and been grabbed off the street and made to open the batting. Still, we’ll miss him, even if that’s because there’s always plenty to write about him.
Example 4: Sir Ian Botham
Something that we’ve touched on before is Ian Botham’s career decline. After a sensational start, everything gradually tailed off, hence the move towards that bottom left corner, probably driven by the fact that the man himself was very clearly mental. If we could do an equivalent chart for commentating, we might see a similar decline. Although it’d probably start in the deepest darkest bit of the red quadrant and then go into negative numbers, so it might blow your mind.
While we could carry on adding in Wiggle charts (including a hilarious blank one for Gavin Hamilton), we should probably just summarise what we’ve found, which is that there’s more than one way to look at a career. We can use the final numbers to make a (usually reasonably accurate) assessment or we can look at how they got there, allowing us to make a bunch of odd looking charts, charts that have ‘award winning journalism’ written all over them. If you would like to nominate 51allout for some sort of award, we guarantee to put 350 million quid back into the NHS when we win.
That should do it.
Latest Poll

2 Comments
Post a Comment
1
Nichael Bluth
25 Jul 2016 02:16
We have done something on Devon Malcolm: http://www.51allout.co.uk/2011-10-27-what-ever-happened-to-the-unlikely-lads-3-devon-malcolm/
As for Gladstone Small, it’s quite hard to stretch a joke about Klippel–Feil syndrome to a thousand words, but we’ll see what we can do.
2
Oliver
22 Jul 2016 03:16
I’m honoured that you followed up on my suggestion. Now all I need is an article focusing on Gladstone Small and Devon Malcolm for my life to be complete. I’ll let you work out the details.